Volume Stack US Top 40 [Pt]█ Overview
Volume Stack US Top 40 is a versatile TradingView indicator designed to give you an at-a-glance view of market sentiment and volume dynamics across the top 40 U.S. large-cap stocks. Inspired by the popular Saty Volume Stack, this enhanced version aggregates essential volume and price strength data from major tickers on both the NYSE and NASDAQ, and works seamlessly on all timeframes.
█ Key Features
Dynamic Buy / Sell Volume Stack: This indicator dynamically stacks the volume bars so that the side with higher volume appears on top. For example, green over red signals more buy-side volume, while red over green indicates greater sell-side volume.
Cross-Market Analysis: Easily toggle between NYSE and NASDAQ to analyze the most influential U.S. stocks. The indicator automatically loads the correct set of tickers based on your selection.
Flexible Coverage: Choose from Top 10, Top 20, Top 30, or Top 40 tickers to tailor the tool to your desired scope of analysis.
Dynamic Table Display: A neat on-chart table lists the selected ticker symbols along with visual cues that reflect each stock’s strength. You can even remove exchange prefixes for a cleaner look.
█ Inputs & Settings
Market Selector: Choose whether to view data from the NYSE or NASDAQ; the indicator automatically loads the corresponding list of top tickers.
Number of Tickers: Select from ‘Top 10’, ‘Top 20’, ‘Top 30’, or ‘Top 40’ stocks to define the breadth of your analysis.
Color Options: Customize the colors for bullish and bearish histogram bars to suit your personal style.
Table Preferences: Adjust the on-chart table’s display style (grid or one row), text size, and decide whether to show exchange information alongside ticker symbols.
█ Usage & Benefits
Volume Stack US Top 40 is ideal for traders and investors who need a clear yet powerful tool to gauge overall market strength. By combining volume and price action data across multiple major stocks, it helps you:
Quickly assess whether the market sentiment is bullish or bearish.
Confirm trends by comparing volume patterns against intraday price movements.
Enhance your trading decisions with a visual representation of market breadth and dynamic buy/sell volume stacking.
Its intuitive design means you spend less time adjusting complex settings and more time making confident, informed decisions.
Wyszukaj w skryptach "VOLUME BAR"

RVOL Color-Coded VolumeRVOL Color-Coded Volume Indicator
This tool visualizes volume intensity through color-coded bars in a separate panel, making it easy to identify significant market moves driven by unusual volume.
Key Features:
- Displays volume bars with varying colors and intensities based on RVOL (Relative Volume)
- Shows a customizable moving average line for volume reference
- Includes alert conditions for different RVOL thresholds
Color System:
Blue shades (Bullish):
- Light: Normal volume (RVOL < 1)
- Medium: Above average volume
- Dark: Heavy buying volume
- Solid: Extreme volume surge
Pink shades (Bearish):
- Light: Normal volume (RVOL < 1)
- Medium: Increased selling
- Dark: Heavy selling
- Solid: Extreme selling pressure
Gray shades (Neutral):
- Used when opening and closing prices are equal
- Intensity varies with RVOL level
Additional Features:
- Dotted threshold lines for easy reference
- Background highlighting for extreme volume events
- Data window shows exact RVOL values
- Multiple alert conditions for volume thresholds
The indicator helps traders spot potential trend changes and momentum shifts by highlighting unusual volume patterns without interfering with price analysis.

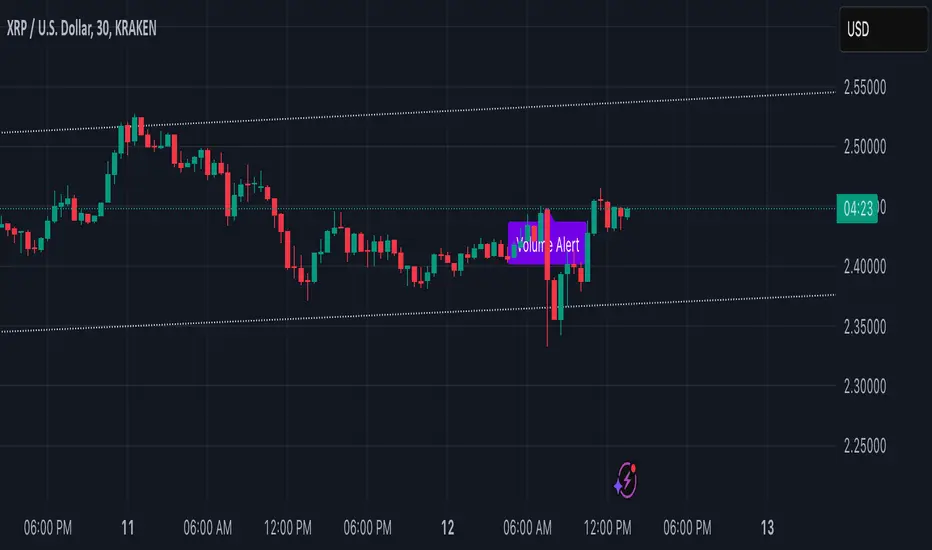
Volume Alert with Adaptive Trend - MissouriTimElevate your market analysis with our "Volume Alert with Adaptive Trend" indicator. This powerful tool combines real-time volume spike notifications with a sophisticated adaptive trend channel, providing traders with both immediate and long-term market insights. Customize your trading experience with adjustable volume alert thresholds and trend visualization options.
Features Summary
Volume Alert Features:
Volume Spike Detection:
Alerts you when volume exceeds a user-defined multiplier of the 20-period Simple Moving Average (SMA) of volume, helping identify potential market interest or significant price movements.
Visual Notification:
A "Volume Alert" label appears on the chart in a striking purple color (#7300E6) with white text, making high volume bars easily noticeable.
Customizable Sensitivity:
The volume spike threshold is adjustable, allowing you to set how sensitive the alert should be to volume changes, tailored to your trading strategy.
Alerts:
An alert condition is set to notify you when a volume spike occurs, ensuring you don't miss potential trading opportunities.
Adaptive Trend Features
Adaptive Channel:
Visualizes market trends through a dynamic channel that adjusts to price movements, offering insights into trend direction, strength, and potential reversal points.
Lookback Period:
Choose between short-term or long-term trend analysis with a toggle that adjusts the calculation period for the trend channel.
Channel Customization:
Fine-tune the trend channel with options for deviation multiplier, line styles, colors, transparency, and extension preferences to match your visual trading preferences.
Non-Repainting:
The trend lines are updated only on the current bar, ensuring the integrity of historical data for backtesting and strategy development.
Integrated Utility
Combination of Tools: This indicator marries the immediacy of volume alerts with the strategic depth of trend analysis, offering a comprehensive view of market dynamics.
User Customization: With inputs for both volume alerts and trend visualization, the indicator can be tailored to suit various trading styles, from scalping to swing trading.
This indicator ensures you're always in tune with market movements, providing crucial information at a glance to inform your trading decisions.
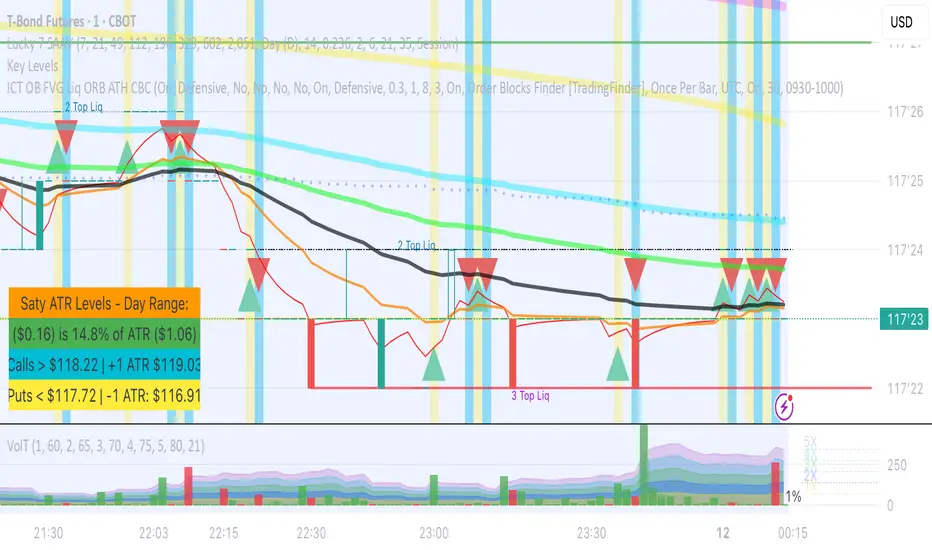
Follow the Volumes / Path of Least ResistanceThis indicator tracks price movements following significant volume increases. It identifies volume spikes by comparing recent average volume to a longer-term average. After a spike, it monitors price changes over a specified number of bars.
In plain English, the point of this is to “let the market show it’s hand”, vs. other common and preemptive methods of execution.
You can think of it as a better version of a volume up/down indicator which only uses opening and closing prices to identify "bullish" or "bearish" behavior.
To optimize this, I used a very small range chart, hence the small values. You will need to experiment with other values, ESPECIALLY the % change. If you do not do this, the indicator will generate a lot of noise.
The indicator has three main conditions:
1. Significant price increase, bullish: A green triangle appears below the bar.
2. Significant price decrease, bearish: A red triangle appears above the bar.
3. Price change within thresholds: A fuschia triangle appears, pointing up or down based on the overall (short-term) trend. This is common behavior during trends. A spike in volume will appear, and price simply does not budge. Volume/price is essentially declaring a new found value, in which case prices tend to follow the impulse movement (see market profile theory).
The color scheme is intuitive: green for positive moves, red for negative, and fuschia for subtle changes following the existing trend. Blue circles mark volume spikes for reference, which I recommend using only for reference, and disabling to remove unneeded noise.
Because this indicator "lags" in the sense of waiting for the market to show its hand, best opportunities are typically found on retests of the volume spikes themselves. On drives, however, the market will unlikely pullback, which (in my view) is one of its best use cases.
Bottom line, you will need to adjust the parameters to the instrument. This is not a plug and play solution, but far more accurate than those which are.
Settings, and what they mean:
Volume spike average bars: length for identification of high volumes. On smaller timeframes, such as my optimization period, you’ll want several bars. But on something such as a 5 minute or higher, only 1.
Lookback period: for identification of high volumes.
Volume Increase Threshold (%): % which constitutes a jump in volume
Bars After Spike: How long to wait for ensuing price movement. Also sensitive to the timeframe you are using. 1-2 recommended for 5m+, more for smaller range-based.
Negative Price Change Threshold (%): For red arrows (Volume + Price Movement)
Positive Price Change Threshold (%): Inverse of above
WMA Period for Stability Function: When price spikes on high volumes but does not move (price is “trapped” between negative and positive price change thresholds) the indicator marks direction (in fuchsia) in the direction of the underlying trend. This short-term MA identifies that trend.
Finally, because this indicator is volume-based, I recommend using primary instruments only and discourage its use on CFDs or other firm-generated instruments. Just use the primary. I would ignore signals off the open, which is subject to erroneous behavior. Other methods are far more effective for that.
This script is purposely uncomplicated. Feel free to play with settings and change code to suit your needs.

ADX Volume Trend
Thie indicator is a modified and upgraded version of the popular ADX tool.
ADX is used to determine the strength of a trend, and also to determine the direction in which the trend is likely to go.
With this script, I have added in the formula the usage of volume, leading to the following functionality.
The length is used to determine the period to calculate the trend strength and direction, and the average is used to then determine the oscillator and to confront the previous line.
The volume average determines how many volumes bars the indicator should use to determine if a volume bar is above or below average if volume mode is selected.
With the volume mode on, you'll get the DI+ and DI- lines, which are by default displayed as a histogram that calculates the difference between the two lines, called "Directional difference", are calculated using also the volume in the formula, multiplying the normal output by the volume multiplier. I suggest using this mode in high-volume markets.
The trend strength difference is the area calculated using the difference between the ADX line and his moving average and can be used to analyze divergences in the swing points.
It has a lot of improvements and new functionalities, like:
- Histogram to show the output at best
- Averages to compare the data
- The option to include the volume inside of the formula
- Other options and esthetic changes
This indicator is created to improve the usability of the popular ADX indicator, including the very important variable of the volumes, in fact, it's the best to use for the Volume Spread Analysis.

Auto Anchored Volume Weighted Average Price - Custom AVWAP
Based on Brian Shannon's AVWAP - This indicator anchors vwap to the highest high, lowest low and highest volume bar of a user defined lookback period.
In the chart example above on AVAX, the lookback period is set to 90 days
- The blue line depicts AVWAP from the highest bar in in the last 90 dats
- The purple Line is AVWAP from the lowest bar in the last 90 days
- The golden line is AVWAP from the highest volume bar in the last 90 Days
These levels act as a price magnet and strong levels of support and resistance. I use them to identify chart locations for where I want to do business and look for trade setups.
Unlike moving averages, AVWAP will maintain it's chart position no matter the chart resolution. One way to take advantage of this is to wait for price to get to one of these levels, go to lower timeframes and find low risk setups based on your trading strategy.
You can customise the look and feel and which anchors you want displayed. You can use multiple instances with varying lookback periods to display shorter and longer term levels simultaneously

Volume USDTName:
USDT Volume Bars (Directional Colors)
Description:
This indicator visualizes trading volume in USDT by multiplying the candle's volume by the average of its open and close prices. The result reflects a more realistic estimation of the traded value per candle.
🟩 Green bars: Bullish or neutral candles (close ≥ open)
🟥 Red bars: Bearish candles (close < open)
Useful for spotting high-value inflows and outflows based on actual price-weighted volume.

MarketSmith VolumesThe 'MarketSmith Volumes' is to be used with the 'MarketSmith Indicator' and 'EPS & Sales' in order to mimic fully MarketSmith Graphs with the maximum number of indicators allowed by a free Tradingview Plan: 3
This indicator is no more than a simple volume indicator where all parameters are already adjusted to resemble MarketSmith graphical volumes.
Also you will find integrated:
High Volumes Bars Peak :
They allow us to see peak volumes at a glance.
10-Week Average Volume :
When viewing a weekly chart, this line represents a 10-week moving average volume level. It allows you to see if the current Volume Bar of the week is above or under the average volume traded in the past 10 Weeks.
50-Day Average Volume :
When viewing a daily chart, this line represents a 50-day moving average volume level. Whether or not volume is above or below the average for a certain period could have a significant impact on your stock chart analysis.

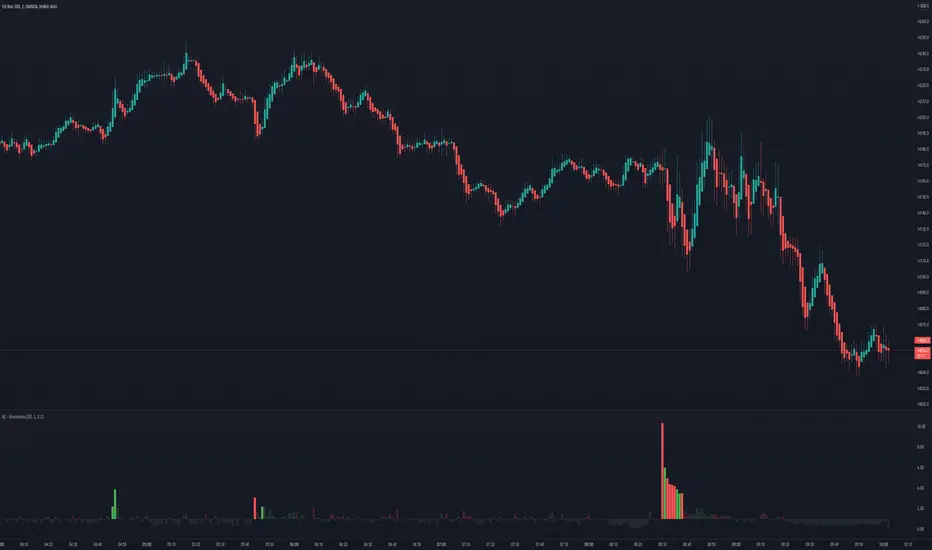
VolT by empowerTVolT is conceived to expose and alert volume volatility.
Using 21-candle moving average volume values compared to the current candle volume, you can graphically see the volume as it comes in - as a percentage of the historic 1X volume moving average.
Getting close to 2X or 5X of the 21-candle SMA? Just glance at the transparent plots behind the volume bars - or the actual percentage value in yellow.
Never wonder again how much volume that bar is compared to previous volume - now you know. Set alerts based on the volume crossing your chosen volume SMA. You'll never be surprised that the hedgies loaded up and left you behind, because you'll be right there loading up with them. (Let me know if you need help setting the alerts...)
As always, your feedback and criticisms are appreciated.
Volume Average Cross - VAC ChartVolume Average Cross Chart Indicator
This indicator plots signals from two different volume averages when they cross on the chart.
It does not show the default volume bars, to see them please go to my VAC Default Indicator.
This is VAC Chart. If you want to see the crosses on your volume bars and not on the chart please go to my VAC Default Indicator.
Rules:
Fast Volume Period always has to be lower than the Slow Volume Period to trigger correct signals.
Inputs:
-> Fast Volume Average Period
-> Slow Volume Average Period
-> Option to enable/disable the cross-signals

VAMA Volume Adjusted Moving Average BandsThis indicator is standard deviation bands using a live analysis adaptation of Richard Arms' Volume Adjusted Moving Average as their basis. VAMA utilizes a period length that is based on volume increments rather than time.
• SampleN - N volume bars used as sample to calculate average volume , 0 equals all bars.
• VAMA Source - Price used for volume weighted calculations.
• VAMA Length - Specified number of volume ratio buckets to be reached.
• VAMA VI Fct - Size of volume ratio buckets.
• VAMA Strict - Must meet desired volume requirements, even if number of bars has to exceed VAMA Length to do it.
• STDV Factor - Standard Deviation multiplier.
• STDV Length - Standard Deviation period.
• Brightness - Color opaqueness for the band fills.
Please see previous published example here for more details on VAMA's usage and inability to redraw the past on time based charts.
NOTICE: This is an example script and not meant to be used as an actual strategy. By using this script or any portion thereof, you acknowledge that you have read and understood that this is for research purposes only and I am not responsible for any financial losses you may incur by using this script!

VAMA Volume Adjusted Moving Average FunctionThis indicator is a live analysis adaptation of Richard Arms' Volume Adjusted Moving Average coded as a single function. VAMA utilizes a period length that is based on volume increments rather than time. Settings are provided for using as a pair of fast and slow moving averages.
• SampleN - N volume bars used as sample to calculate average volume , 0 equals all bars.
• VAMA Source - Price used for volume weighted calculations.
• VAMA Length - Specified number of volume ratio buckets to be reached.
• VAMA VI Fct - Size of volume ratio buckets.
• VAMA Strict - Must meet desired volume requirements, even if number of bars has to exceed VAMA Length to do it.
Please see previous published example here for more details on VAMA's usage and inability to redraw the past on time based charts.
NOTICE: This is an example script and not meant to be used as an actual strategy. By using this script or any portion thereof, you acknowledge that you have read and understood that this is for research purposes only and I am not responsible for any financial losses you may incur by using this script!

Accumulation Phase DetectorClean Accumulation Phase Indicator — Description
This TradingView indicator visually identifies the Accumulation Phase in price action, based on the Wyckoff methodology and volume-price analysis. The Accumulation Phase is where insiders or "smart money" gradually build positions before a significant price breakout.
Key Features:
Range Detection: The indicator calculates a price range over a configurable period (Range Length). It marks this range on the chart with red horizontal lines representing support and resistance.
Volume Spike Identification: It detects unusually high volume relative to the average volume over the same period (Volume Spike Multiplier). These spikes highlight potential insider buying activity.
Accumulation Phase Highlighting: When price action remains within the detected range and volume spikes occur, the indicator considers the market to be in an accumulation phase. Volume bars during this phase are colored blue for easy visualization.
Campaign Start & End Labels: The indicator places a "Campaign starts" label at the beginning of the accumulation phase and a "Campaign ends - warehouse full" label when the accumulation ends. This mimics the idea that insiders fill their “warehouses” before a breakout.
Breakout Detection: Once accumulation ends, the indicator monitors for a price breakout above the resistance level and places a "Breakout" label at the breakout bar.
How to Use:
Adjust the Range Length and Volume Spike Multiplier inputs to suit the timeframe and instrument you’re analyzing.
Watch for the blue volume bars within the red range lines to identify the accumulation phase.
Use the campaign labels to identify when the phase starts and ends.
Watch for the breakout label as a potential entry signal.

Bogdan Ciocoiu - GreuceanuDescription
This indicator is an entry-level script that simplifies volume interpretation for beginning traders.
It is a handy tool that removes all the noise and focuses traders on identifying potential smart money injections.
Uniqueness
This indicator is unique because it introduces the principle of a moving average in the context of volume and then compares it with tick-based volume.
Its uniqueness is reflected in the ability to colour code each volume bar based on the intensity of each relevant (volume) unit whilst comparing it with the volume moving average.
Another benefit of this indicator is the colour coding scheme that removes volume below a particular threshold (default set to 1) under the volume moving average.
In addition to the above features, the indicator differentiates the colour of each bar by price direction.
Open source re-use
To achieve this functionality several open source indicators have been used an integrated within the current one.
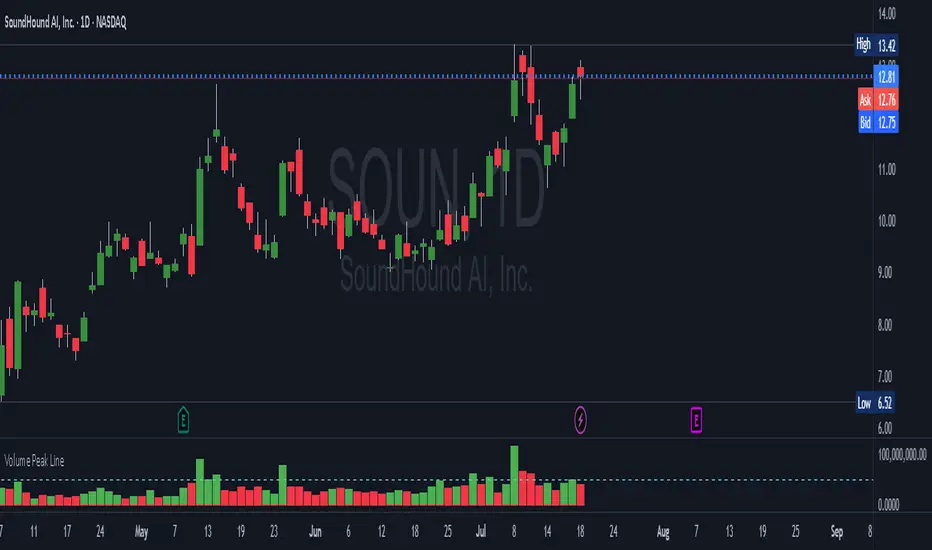
Volume Peak LineA fully configurable “Volume Peak Line” indicator that draws a horizontal threshold at the highest volume over the last X candles (default 5).
Custom lookback (X volume candles)
Optional alert when current volume exceeds that peak
Separate up/down volume bars (green/red) or hide them to use your own volume overlays
Use it to spot surges in trading activity on any timeframe—ideal for intraday or swing setups where a barn-burner volume bar can signal a reversal or the start of a new trend.
Volume and Volatility Ratio Indicator-WODI策略名称
交易量与波动率比例策略-WODI
一、用户自定义参数
vol_length:交易量均线长度,计算基础交易量活跃度。
index_short_length / index_long_length:指数短期与长期均线长度,用于捕捉中短期与中长期趋势。
index_magnification:敏感度放大倍数,调整指数均线的灵敏度。
index_threshold_magnification:阈值放大因子,用于动态过滤噪音。
lookback_bars:形态检测回溯K线根数,用于捕捉反转模式。
fib_tp_ratio / fib_sl_ratio:斐波那契止盈与止损比率,分别对应黄金分割(0.618/0.382 等)级别。
enable_reversal:反转信号开关,开启后将原有做空信号反向为做多信号,用于单边趋势加仓。
二、核心计算逻辑
交易量百分比
使用 ta.sma 计算 vol_ma,并得到 vol_percent = volume / vol_ma * 100。
价格波动率
volatility = (high – low) / close * 100。
构建复合指数
volatility_index = vol_percent * volatility,并分别计算其短期与长期均线(乘以 index_magnification)。
动态阈值
index_threshold = index_long_ma * index_threshold_magnification,过滤常规波动。
三、信号生成与策略执行
做多/做空信号
当短期指数均线自下而上突破长期均线,且 volatility_index 突破 index_threshold 时,发出做多信号。
当短期指数均线自上而下跌破长期均线,且 volatility_index 跌破 index_threshold 时,发出做空信号。
反转信号模式(可选)
若 enable_reversal = true,则所有做空信号反向为做多,用于在强趋势行情中加仓。
止盈止损管理
进场后自动设置斐波那契止盈位(基于入场价 × fib_tp_ratio)和止损位(入场价 × fib_sl_ratio)。
支持多级止盈:可依次以 0.382、0.618 等黄金分割比率分批平仓。
四、图表展示
策略信号标记:图上用箭头标明每次做多/做空(或反转加仓)信号。
斐波那契区间:在K线图中显示止盈/止损水平线。
复合指数与阈值线:与原版相同,在独立窗口绘制短、长期指数均线、指数曲线及阈值。
量能柱状:高于均线时染色,反转模式时额外高亮。
Strategy Name
Volume and Volatility Ratio Strategy – WODI
1. User-Defined Parameters
vol_length: Length for volume SMA.
index_short_length / index_long_length: Short and long MA lengths for the composite index.
index_magnification: Sensitivity multiplier for index MAs.
index_threshold_magnification: Threshold multiplier to filter noise.
lookback_bars: Number of bars to look back for pattern detection.
fib_tp_ratio / fib_sl_ratio: Fibonacci take-profit and stop-loss ratios (e.g. 0.618, 0.382).
enable_reversal: Toggle for reversal mode; flips short signals to long for trend-following add-on entries.
2. Core Calculation
Volume Percentage:
vol_ma = ta.sma(volume, vol_length)
vol_percent = volume / vol_ma * 100
Volatility:
volatility = (high – low) / close * 100
Composite Index:
volatility_index = vol_percent * volatility
Short/long MAs applied and scaled by index_magnification.
Dynamic Threshold:
index_threshold = index_long_ma * index_threshold_magnification.
3. Signal Generation & Execution
Long/Short Entries:
Long when short MA crosses above long MA and volatility_index > index_threshold.
Short when short MA crosses below long MA and volatility_index < index_threshold.
Reversal Mode (optional):
If enable_reversal is on, invert all short entries to long to scale into trending moves.
Fibonacci Take-Profit & Stop-Loss:
Automatically set TP/SL levels at entry price × respective Fibonacci ratios.
Supports multi-stage exits at 0.382, 0.618, etc.
4. Visualization
Signal Arrows: Marks every long/short or reversal-add signal on the chart.
Fibonacci Zones: Plots TP/SL lines on the price panel.
Index & Threshold: Same as v1.0, with MAs, index curve, and threshold in a separate sub-window.
Volume Bars: Colored when above vol_ma; extra highlight if a reversal-add signal triggers

Adaptive Scaled LevelsThis indicator allows users to manually define a list of price levels (e.g., round or psychological numbers) and automatically scales them to fit any asset's current price range using an intelligent anchor point. It then plots dynamic horizontal zones ideal for identifying potential supply/demand or reaction areas.
How It Works (Technical Methodology)
Manual Price List Input
Users enter a comma-separated list of price levels via a text area input (default example: 50,100,...,1400). These act as a "template" grid – often round numbers, psychological levels, or custom targets.
Auto-Scaling Logic (Core Innovation)
When enabled:
Calculates the average of the input list.
Determines a smart anchor price:
Default (Lock = 0): Close price of the highest-volume bar in the last user-defined lookback period (default 200 bars), fetched from a selectable timeframe (default Daily) via request.security().
Override: User can manually lock the anchor to any fixed price.
Computes a scale factor = Anchor / List Average.
Multiplies every input level by this factor to adapt the entire grid to the current market (e.g., scales low-price templates to BTC's 60k+ range).
Zone Construction
For each scaled level:
Creates a horizontal box centered on the level.
Height = Level × user-defined percentage (default 0.5%) for volatility-adjusted thickness.
Zones extend infinitely to the right for continuous reference.
Supply/Demand Coloring
Levels above current close: Supply color (default light gray) – potential resistance/overhead supply.
Levels below current close: Demand color (default cyan) – potential support/underlying demand.
Visual Elements
Transparent filled boxes with borders.
Optional labels showing "S" (Supply) or "D" (Demand) plus exact price.
Clean, non-cluttering design – redraws only on last bar for performance.
How to Use
This tool is perfect for plotting adaptive psychological/round number grids across any asset without manual adjustment.
Common Template: Use evenly spaced round numbers (e.g., 100 increments) as input – the script handles scaling.
BTC/ETH/Crypto: Enable auto-scaling with Daily timeframe anchor for high-volume alignment (often near fair value).
Forex/Stocks: Lower zone height % for tighter zones; use shorter lookback or lock anchor for stability.
Trading Applications:
Anticipate reactions/bounces at scaled levels (confluence with price action, volume, or order blocks).
Supply zones (above price): Potential short entries or take-profit targets.
Demand zones (below price): Potential long entries or stop-loss placement below.
Override anchor for specific analysis (e.g., lock to all-time high).
Best Practices: Combine with trend direction, higher-timeframe structure, or liquidity concepts for higher-probability setups.
Highly versatile – works on any timeframe/asset, especially volatile ones like cryptocurrencies where fixed levels quickly become irrelevant.
Disclaimer
This indicator is a technical analysis tool and should be used in conjunction with other forms of analysis. Past performance does not guarantee future results. Always use proper risk management.

ShooterViz Lazy Trader EMA SystemShooterViz Lazy Trader EMA System - Complete User Guide
What This Script Does
This is a position scaling indicator that tells you exactly when to enter, add to, and exit trades using a simplified 5-EMA system. It removes the guesswork and decision fatigue from trading by giving you clear visual signals.
The Core Concept
3 entry signals that build your position from 20% → 50% → 100%
2 exit signals that scale you out at 50% → 50% (complete exit)
1 higher timeframe filter that keeps you on the right side of the trend
No Fibonacci calculations, no RSI divergence, no multi-indicator confusion. Just EMAs and price action.
What You'll See On Your Chart
1. Colored EMA Lines
Blue Lines (Entry Zone):
3 EMA (lightest blue) - Early reversal detector
5 EMA (darker blue) - Confirmation line
Green Lines (Add Zone):
21 EMA (bright green) - First add location
34 EMA (lighter green) - Final add location
Red Lines (Exit Zone):
89 EMA (lighter red) - First exit trigger
144 EMA (darker red) - Final exit trigger
Orange Lines (Hyper Frame - optional):
Hyper 21 EMA (from higher timeframe) - Trend direction
Hyper 34 EMA (from higher timeframe) - Bias confirmation
2. Triangle Signals
Green Triangles (Below Price) = BUY/ADD:
Lime triangle with "20%" = Entry 1: Price reclaimed 3→5 EMA (starter position)
Green triangle with "30%" = Entry 2: Price bounced off 21 EMA (first add)
Teal triangle with "50%" = Entry 3: Price broke out from 34 EMA compression (final add)
Red Triangles (Above Price) = SELL:
Orange triangle with "50% OFF" = Exit 1: Price broke below 89 EMA (take half off)
Red triangle with "EXIT ALL" = Exit 2: Price broke below 144 EMA (close remaining position)
3. Background Color (Trend Bias)
Light green background = Hyper frame EMAs trending up (bias LONG)
Light red background = Hyper frame EMAs trending down (bias SHORT)
Gray background = Neutral/choppy (be cautious)
4. Info Table (Top Right Corner)
A live status dashboard showing:
Which entry signals are currently active (✓ or —)
Which exit signals are currently active (⚠ or ⛔)
Current hyper frame bias (🟢 LONG / 🔴 SHORT / ⚪ NEUTRAL)
Which timeframe you're using for hyper frame filtering
How to Install and Set Up
Step 1: Add the Script to TradingView
Open TradingView
Click "Pine Editor" at the bottom of the screen
Copy the entire script code
Paste it into the Pine Editor
Click "Add to Chart"
Step 2: Configure Your Settings
Click the gear icon ⚙️ next to "LazyEMA" in your indicators list.
Critical Settings to Configure:
Hyper Frame Selection (Most Important!)
Location: "Hyper Frame (Pick ONE)" section
Setting: "Timeframe"
What to choose:
Trading 15min or 1H charts? → Use "240" (4-hour)
Trading 4H or Daily charts? → Use "D" (Daily)
Trading Daily or Weekly charts? → Use "W" (Weekly)
Why this matters: This filter keeps you aligned with the bigger trend. Only take longs when this timeframe is green, shorts when it's red.
MA Type (Optional, default is fine)
Location: "MA Config" section
Default: EMA (recommended)
Options: EMA, SMA, WMA, HMA, RMA, VWMA
Most traders should stick with EMA
Visual Toggles (Customize your view)
Entry Zone: Turn individual EMAs on/off (3, 5, 21, 34)
Exit Zone: Turn individual EMAs on/off (89, 144)
Hyper Frame: Toggle the higher timeframe EMAs on/off
Step 3: Clean Up Your Chart
Turn OFF these if visible:
Volume bars (they clutter the view)
Any other indicators you have loaded
Grid lines (optional, but cleaner)
Keep ONLY:
Price candles
Your ShooterViz Lazy Trader EMA System
Maybe support/resistance levels if you manually draw them
How to Trade With This Script
The Basic Workflow
Before the Market Opens:
Check the background color and info table bias
Green background? Look for LONG setups only
Red background? Look for SHORT setups only
Gray background? Stay flat or trade small
During the Trading Session:
LONGS (When hyper frame is bullish):
Wait for Entry 1 signal:
Lime triangle appears with "20%"
Price has reclaimed the 5 EMA after dipping to 3 EMA
Action: Enter 20% of your intended position
Stop loss: Place below the 5 EMA or recent swing low
Wait for Entry 2 signal:
Green triangle appears with "30%"
Price pulled back to 21 EMA and bounced
Action: Add 30% more (you're now at 50% total)
Move stop: Trail it up to below 21 EMA
Wait for Entry 3 signal:
Teal triangle appears with "50%"
Price compressed at 34 EMA and broke out
Action: Add final 50% (you're now 100% loaded)
Move stop: Trail it up to below 34 EMA
Wait for Exit 1 signal:
Orange triangle appears with "50% OFF"
Price broke below 89 EMA
Action: Exit 50% of your position immediately
Move stop on rest: Trail to 89 EMA or lock in profits
Wait for Exit 2 signal:
Red triangle appears with "EXIT ALL"
Price broke below 144 EMA
Action: Exit remaining 50% (you're now flat)
Or: Stop gets hit at 89 EMA (same result)
SHORTS (When hyper frame is bearish):
Same process, but inverted
Triangles appear above price instead of below
Look for breakdowns below EMAs instead of bounces off them
Exit when price reclaims 89 and 144 EMAs
Real-World Example Walkthrough
Setup: Trading ES (S&P 500 Futures) on 1H Chart
Chart Configuration:
Timeframe: 1 Hour
Hyper Frame: 240 (4-hour)
Ticker: ES
Pre-Market Check:
Background is light green
Info table shows "🟢 LONG" for Hyper Bias
Decision: Only look for long entries today
9:30 AM - Market Opens
Price dips and touches 3 EMA
Watch for: Reclaim of 5 EMA
9:45 AM - Entry 1 Triggers
Lime triangle appears below bar
Price closed above 5 EMA at $4,550
Action taken:
Enter long 20% position (2 contracts if targeting 10 total)
Stop loss at $4,545 (below 5 EMA)
Risk: $10 per contract × 2 = $20 risk
10:30 AM - Entry 2 Triggers
Price rallied to $4,565, pulls back
Green triangle appears at 21 EMA ($4,555)
Action taken:
Add 30% (3 more contracts, now have 5 total)
Move stop to $4,550 (below 21 EMA)
Current P/L: +$25 ($5 gain on original 2 contracts, break-even on new 3)
11:15 AM - Entry 3 Triggers
Price consolidates at 34 EMA around $4,560
Teal triangle appears as price breaks to $4,568
Action taken:
Add final 50% (5 more contracts, now have 10 total)
Move stop to $4,555 (below 34 EMA)
Current P/L: +$70
1:00 PM - Price Extends
Price rallies to $4,595 (on track)
89 EMA is at $4,575
No action yet, let it run
2:15 PM - Exit 1 Triggers
Price pulls back from $4,600
Orange triangle appears as price breaks below 89 EMA at $4,580
Action taken:
Exit 50% (5 contracts closed at $4,580)
Keep 5 contracts with stop at 89 EMA ($4,575)
Banked: +$150 average gain on closed 5 contracts
2:45 PM - Exit 2 Triggers
Price continues down
Red triangle appears as price breaks 144 EMA at $4,570
Action taken:
Exit remaining 5 contracts at $4,570
Banked: +$100 on remaining 5 contracts
Final Results:
Total gain: $250 on the trade
Initial risk: $50 (if stopped out at Entry 1)
Risk/Reward: 5:1
Time in trade: ~5 hours
Common Questions
"What if I miss Entry 1? Can I still take Entry 2?"
Yes! Each entry is independent. If you miss the 3→5 reclaim, wait for the 21 EMA bounce. You'll start with a 30% position instead of 20%, but that's fine.
Rule: Never chase. Wait for the next EMA setup.
"What if multiple entry signals trigger at the same bar?"
Rare, but possible. If you see both Entry 1 and Entry 2 trigger together:
Take Entry 1 first (20%)
If the next bar confirms Entry 2 is still valid, add 30%
When in doubt, scale in gradually
"The hyper frame is green but I'm seeing short signals?"
Don't take them. The hyper frame is your bias filter. If it says "go long," ignore short setups. They're usually lower probability and will get stopped out.
"Can I use this for swing trading overnight?"
Absolutely. Just switch your hyper frame:
If you're on Daily charts, use Weekly hyper frame
If you're on 4H charts, use Daily hyper frame
Adjust position sizes for overnight risk
"What if the signal appears right at market close?"
Don't chase it. Wait for the next bar (next day) to confirm. Signals that appear in the last 5 minutes are often noise.
"How do I set up alerts?"
Right-click on the chart
Select "Add Alert"
Choose "LazyEMA" from the condition dropdown
Select which signal you want alerts for:
Entry 1: 3→5 Reclaim
Entry 2: 21 EMA Add
Entry 3: 34 EMA Breakout
Exit 1: 89 EMA Break
Exit 2: 144 EMA Break
Click "Create"
Pro tip: Set up all 5 alerts so you never miss a signal.
Position Sizing Guide see
swingtradenotes.substack.com
Critical Rule: Know your total risk BEFORE you take Entry 1. Don't wing it.
Customization Tips
For Day Traders (Scalpers)
Use 5min or 15min charts
Hyper frame: 1H or 4H
Expect 2-4 setups per day
Tighter stops (0.5% risk per entry)
For Swing Traders
Use 4H or Daily charts
Hyper frame: Daily or Weekly
Expect 1-2 setups per week
Wider stops (1-2% risk per entry)
For Position Traders
Use Daily or Weekly charts
Hyper frame: Weekly or Monthly
Expect 1-2 setups per month
Widest stops (2-3% risk per entry)
The "Don't Be Stupid" Checklist
Before taking ANY signal from this script, ask:
✅ Is the hyper frame bias pointing in my direction?
✅ Is the signal clean (not at a weird time or during news)?
✅ Do I know my stop loss level?
✅ Do I know my position size?
✅ Can I afford to lose if this trade fails?
If you answered "no" to ANY of these, skip the trade.
Troubleshooting
"I'm not seeing any signals"
Possible causes:
The "Show Lazy Trader System" toggle is off (turn it on)
Your chart timeframe is too high (try 1H or 4H)
Market is in a tight range (EMAs are compressed)
You need to refresh the chart
"Too many signals, getting whipsawed"
Fixes:
Increase your chart timeframe (go from 15m to 1H)
Switch to a less volatile ticker
Only trade when hyper frame bias is STRONG (not neutral)
Add a minimum bar count between signals
"The info table is covering my price action"
Fix:
Edit the script
Find the line: table.new(position.top_right, ...
Change position.top_right to position.bottom_right or position.top_left
"Signals appear then disappear"
This is normal (repainting). Some signals (especially compression breakouts) can disappear if the next bar reverses. This is why you:
Wait for bar close before acting
Use alerts that only fire on confirmed bars
Don't chase signals mid-bar
Final Thoughts
This script is a decision-making tool, not a crystal ball. It shows you high-probability setups based on EMA dynamics and trend structure. You still need to:
Manage your risk
Choose your position size
Stick to the rules
Accept losses when they happen
The system works when YOU work the system.
Print this guide, tape it next to your monitor, and follow it religiously for 20 trades before making ANY changes.
Good luck, and stay lazy (the smart way).

Volume (Custom Timeframe & Color)This indicator displays volume data from a custom timeframe, regardless of the current chart resolution.
The bar color is determined by the price movement of the selected timeframe (green for bullish, red for bearish).
Features:
- Select any custom timeframe for volume (e.g., 5m, 15m, 1h, 1D).
- Volume bars are painted according to the candle direction of that timeframe.
- Useful for multi-timeframe analysis and detecting higher timeframe volume trends.
Inspired by TradingView’s built-in Volume indicator, but enhanced with custom timeframe and consistent coloring.

High Volume BarsThis script colors bars whenever their volume has exceeded more than a standard deviation (or multiples of it) from a given amount of bars in the past.
Volume is commonly used as confirmation for a break of a significant level, or as indicative of offside positions when a level fails to be defended. Conviction or Excess, depending on the context.

Multi MA on candlestick volume indicatorUses 5 volume moving averages to change the candlestick color depending on how high above average volume is.
The volumes plotted at the bottom of the chart are set to the same settings as the indicator, you can see the volume bars that stick higher above the orange moving average are a different color on the chart to the smaller ones.
Any volume bar that is below the moving average is colored purple.

Volume, Simple Relative Volume HighlightThis script plots volume bars and highlight bars that have an unusual activity, compare to the average (Standard: Simple Moving Average, 50 periods).
The script is useful for checking daily volume levels on equities. Where there is high volume, there is likely volatility, wich is good for day trading and swing trading entries.

VolumeZThis study show you the volume bar that are significant above the median >2 times per 5 bars
the volume bar is shown as volume/price
you can change and modify to make it better :)
